Posted June 13, 2026
SpaceX (SPCX) IPO Chart
I am using the SpaceX IPO chart for June 12, 2026, at the first trade time of 11:45 AM, calculated for Brownsville, Texas, with Leo 15°23′ rising. The chart appears exceptionally strong. Moon is exalted in Taurus, Jupiter is exalted in Cancer, and Venus is conjunct Jupiter. The Moon and Venus are in mutual exchange (Parivartana Yoga), linking public participation with gains and investor support.
A Navamsha containing three exalted planets—Moon, Venus, and Sun is unusual and suggests that the underlying potential of the chart may be stronger than what appears on the surface. The fact that both the Ascendant and Moon are Vargottama is particularly noteworthy. Vargottama generally strengthens a planet’s ability to consistently and effectively express its inherent nature. An Ascendant that is Vargottama can add durability and resilience to the chart, while a Vargottama Moon can strengthen public appeal, popularity, and investor sentiment. The current Shashti-hayini dasha is Jupiter/Moon, with both planets exalted, adding to the positive outlook.
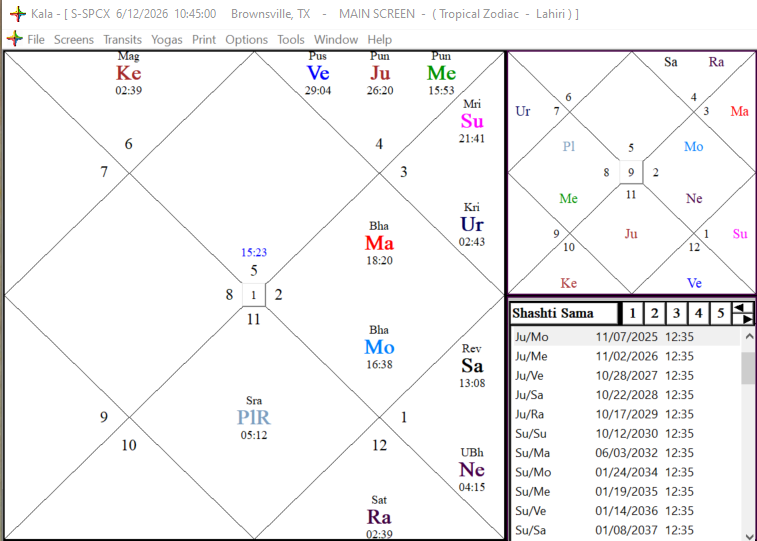
At the same time, the chart contains a Kaal-Sarp configuration, which often points to extreme outcomes rather than average results. This can manifest as either exceptional success or significant challenges. Saturn is debilitated in Aries and squares Mercury, suggesting delays, regulatory issues, technical setbacks, or conflicts between market expectations and operational realities.
Mercury, Saturn, Moon, and Mars are all very close to house cusps, making them especially influential. The Moon-Mars combination suggests strong momentum, active trading interest, and potentially large price swings. Overall, the chart combines unusually powerful growth and wealth-producing factors with signatures of volatility and periodic obstacles.
My current conclusion is that SPCX is unlikely to be a quiet stock. It has the potential for major public interest, substantial long-term growth, and leadership within its industry, but the path may include sharp advances, corrections, and occasional setbacks. Strong IPO phase and favorable trend during Jupiter/Venus through roughly October 2026, followed by a more challenging and potentially corrective Jupiter/Mercury period extending into approximately October 2027.
10/30/2022
Exxon-Mobile Corp (XOM)
Exxon Mobil Corporation explores and produces crude oil and natural gas in the United States and internationally. It operates through Upstream, Downstream, and Chemical segments. The company was founded in 1870 and is based in Irving, Texas. Since this is a very old company, it is difficult to find its IPO date, mainly because it has undergone many mergers and acquisitions. I got its IPO date from a book called “Planetary Stock Trading,” where the author went to the company head-quarter and searched old documents to find the correct first trade date.
Here is the astrology chart of the company.
As usual, I would start with the first house. It has a Ketu (south node) in it. It is, therefore, a long-lived company but not a loved one. Once, it became the most valuable company, but AAPL took it over. The chart has three strong planets. I will talk about them one by one.
Exalted Sun in the twelfth house indicates successful ventures in foreign countries. The exalted Venus in the eleventh house shows a continuous stream of income flowing in under any circumstances. Mars in Scorpio, the sign it rules, in the seventh house, points towards booming chemical and petrochemical industries, components of the company. Rahu occupies the seventh house also, along with Mars. Rahu stands for international affairs. Thus all strong planets in this chart give success in doing business in foreign countries. The planet Mercury also occupies the eleventh house. Although it is fallen, the company of strong Venus gives it ample support and does not allow it to cause much harm to the income.
Retrograde Jupiter occupies the fourth house. On the Shad-Bala scale, this is the strongest planet. Jupiter is the most benefic planet and gives growth at every level. No wonder it is one of the most successful stocks until now. Jupiter aspects the exalted Sun. This is a very positive feature of the chart. This setup would continue to help regain its lost glory.
The planet that is of concern is Moon. It occupies the second house of wealth and finances. Moon is a cyclical planet. The sign Gemini is a dual sign, neither fixed nor mobile. The effect of the Moon in the second house, therefore, has made this company highly cyclical and dependent upon the oil price. Moon is under the aspect of Saturn. This may be the reason why it remains loved and hated for an extended period of time. The strength of other planets and the aspect of the strongest planet Jupiter on the exalted Sun would continue to bring it to the limelight after any serious drawdowns in the price of oil.
The transit of Jupiter nicely explains the movement of stock price. It was going through the houses with no planet or weak planets for many years. Consequently, its price went nowhere in the last few years. It just started moving through the eleventh house in 2022, where you see exalted Venus present. Next year it will transit over exalted Sun. I, therefore, expect it to do good in 2023 also.
8/28/2022
Blackstone, Inc. (BX)
Blackstone Inc. is an alternative asset management firm specializing in real estate, private equity, hedge fund solutions, credit, secondary funds of funds, public debt and equity, and multi-asset class strategies. For investors, it has produced 16% annualized returns despite the 2008 and 2020 stock market crashes.
This company came public on 6/22/2007, and its headquarter is in New York. Here is the IPO-day astrology chart.
It has Leo ascendant, with the benefic planet Venus occupying the first house. Strong retrograde Jupiter aspects it from the fifth house. This makes the ascendant extremely powerful even though a malefic planet Saturn also occupies it. When the ascendant is Leo, Mars becomes the Raj-yoga Karak planet. Mars in this chart is exceptionally strong. It occupies its own sign, Aries, in the ninth house, a house of good luck and fortune. This combination of Venus in the first house, Jupiter in the fifth, and Mars in the ninth house gives exceptional strength to the chart.
The occupation of the third house by Moon is also a welcome feature of the stock. All the signs of innovation, Gemini, Libra, and Aquarius, have an influence of a benefic planet. Moon occupies Libra, Venus aspects Aquarius and Jupiter aspects Gemini. This provides this company to innovate itself under adverse circumstances. The planet Jupiter is very strong in Navamsha (D-9), which also shows Shubhkartari yoga around the ascendant. Exalted Saturn and Vargottam Sun and Venus provides additional strength to these planets.
The second house that represents wealth and financial well-being is not that strong as it is occupied by Ketu. The lord of the second house, Mercury, is also not in a good house. It is my observation that whenever there is a yoga between the ascendant lord and the lord of either the third or eleventh house, the stock becomes a leader stock. In this chart, the lord of ascendant is Sun and of the eleventh house is Mercury. Both of these planets occupy the twelfth house. This yoga is therefore there, although weak, because the twelfth house is not a good house. It is, for this reason, BX cannot match the results of AAPL and ADBE, which produced 30% and 18% annualized over the same period of time.
In spite of a few weaknesses, it is a great stock to invest in for diversification purposes, as it is a non-technology stock.
3/24/2022
MP Materials Corpn (MP)
The rare earth metals have unusual fluorescent, conductive, and magnetic properties—which make them very useful when alloyed, or mixed, in small quantities with more common metals such as iron. As a result, they are useful in lasers, glass, magnetic materials, industrial processes, smartphones, digital cameras, computer hard disks, fluorescent and light-emitting-diode (LED) lights, flat-screen televisions, computer monitors, and electronic displays.
Inner Mongolia, China, the Bayan Obo mine is the world’s biggest rare earth mine. China is the biggest producer of rare earth elements in the world. Currently, US companies get the vast majority of their rare earth materials and magnets from China. The Mountain Pass mine in California, controlled by MP Materials Corp, is the only active rare-earths mine in the United States. The company was incorporated in 2017. Its headquarter is in Las Vegas, Nevada. It became public on 6/22/2020.
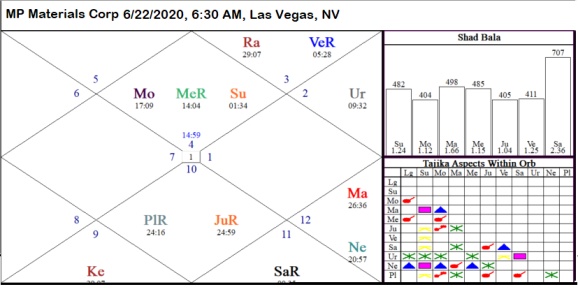
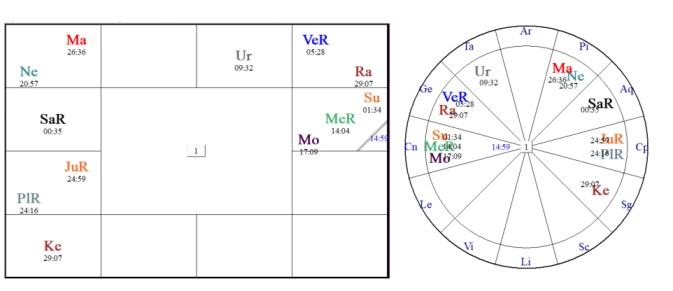
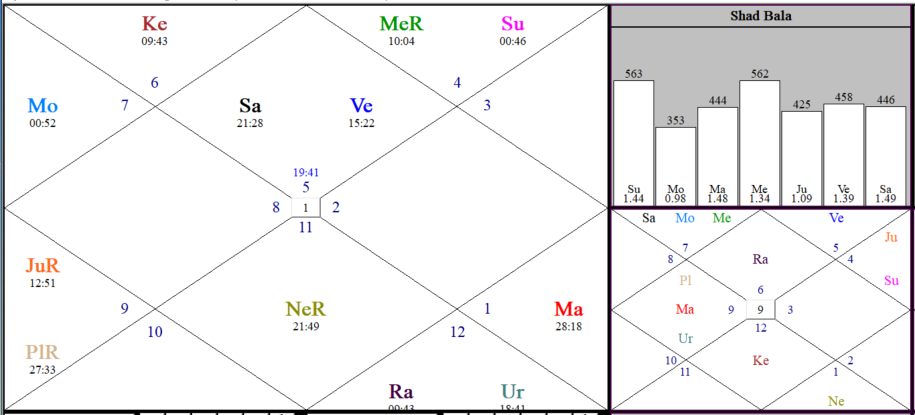
Since it is a relatively new company, I would analyze its chart from all angles. As usual, I will start with the first house. Three planets, Moon, Mercury, and Sun, occupy the ascendant. The sign of ascendant is Cancer. Moon is, therefore, present in its own sign. Mercury rules the third house. Therefore, the conjunction of Moon and Mercury stands for the conjunction of the rulers of the first and third house. This combination is reliable for a company to become successful. Moon also gets the blessings of Jupiter from the seventh house and constitutes a fortunate yoga known as Gaj-Kesari yoga. Since Jupiter is fallen, the aspect of a strong Moon from the ascendant constitutes a Neech-bhang yoga. Sun rules the second house of wealth and finances, and its presence in the first house is a welcome feature.
Looking at the Shad-Bala table, we find that the strongest planet is Saturn. A strong Saturn in the eighth house ensures the long life of the stock. It also makes it a steady and economical company and tactful for running its business. The planet of innovation, Uranus, occupies the eleventh house and gets the blessings of Jupiter. This feature is generally present in highly innovative companies. Mars is a planet of chemical transformation. Since this is a chemistry-based company, Mars should be strong. On the Shad-Bala table, Mars is second only to Saturn in strength.
If we look at the table of Tajika aspects, we find that we have more trine aspects than square aspects between the planets. A trine aspect is considered harmonious, while a square presents challenges.
Now let us look at the weaknesses of the chart. The real problem is the occupation of the twelfth and sixth houses by Rahu and Ketu, respectively. Rahu also gets the aspect of Mars. Since it is a square aspect, it cannot be helpful. This company would therefore face occasional challenges. Since Rahu is in the twelfth house, which represents foreign countries, the competition would come from companies in other countries. In this regard, China comes to mind. I hope that this company can accept and meet such a challenge.
2/21/2022
Brookfield Asset Management (BAM)
Brookfield Asset Management is an alternative asset manager and REIT/Real Estate Investment Manager firm that focuses on real estate, renewable power, infrastructure and venture capital, and private equity assets. The company was founded on April 7, 1899, in Toronto, Canada. Brookfield’s predecessor companies became public and began trading on the TSX in 1902. The present-day Brookfield Asset Management Inc. began trading on the TSX on August 22, 1997, and on the NYSE in December 2000. Since it was already trading in Toronto when it came to the NYSE, we have to use the TSE IPO date for the chart.
The company has generated a 15% annualized return since 1997. No other REIT has done better than this. Here is the IPO date astrology chart.
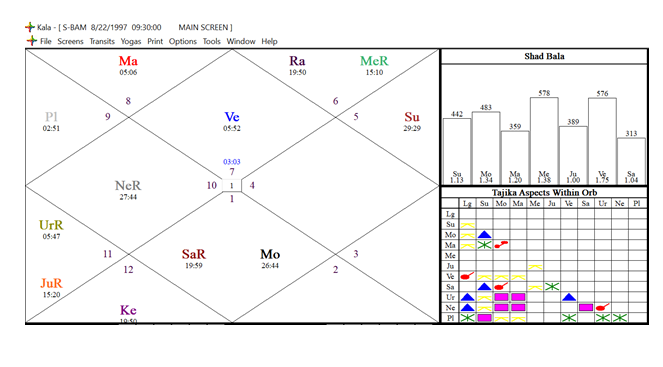
 The most striking feature of this chart is the ascendant, which is the first thing I analyze in a chart. It has the strongest planet Venus, which is present in its own sign, Libra. Venus is a benefic planet and gives excellent results, especially if present in the first house. On top of that, It also gets the blessings of another beneficial planet, Jupiter, from the fifth house.
The eleventh house in a chart is the house that represents income capabilities. This house has Sun in its own sign, Leo. Thus Sun is also very strong. It indicates that the company has consistent earning abilities. As mentioned earlier, the strength of the first house and eleventh or third house makes a strong IPO-day chart. And in this case, both the houses are strong as they have strong planets in them. They are also aspected by Jupiter residing in the fifth house.
The second house shows the financial status and wealth of an entity. In this chart, this house is also occupied by a strong planet. This time, it is Mars in its own sign, Scorpio. Thus three most important houses of a chart, the first, second, and eleventh house, have strong planets. There is another strong planet in the chart. That is Mercury, in the twelfth house. The twelfth house indicates travel to foreign countries. This Mercury, therefore, enables the company to earn money all over the world. Rahu in the twelfth house and Ketu in the sixth house indicate its success through international exposure.
Let us now look at the Moon. It is not as strong as other planets. It is also close to a malevolent planet, Saturn. It is for this reason the stock goes down once in a while. Saturn is utterly weak in this chart, as can be seen from the Shad-Bala table. But the strength of other planets soon enables the company to find out a way to come out of difficult situations. The aspect of Mars on Uranus is also not a desirable feature. But the trine aspect of Venus on Uranus compensates it completely.
All of the above considerations suggest that this is a great stock and would continue to produce stable and consistent income. It may not be as exciting as technology or biotech stocks, but if you want safe and sound income stock, this is the one.
DXCM – Dexcom Inc.
11/12/2021
A few months ago, I wrote about Robinhood Markets in this column, indicating that the IPO-day chart reasonably predicts becoming a growth stock. However, later I found that my analysis was flawed as I overlooked a few issues. I am therefore removing it today and replacing it with a San Diego company, Dexcom Inc., which IPO’ed on 4/14/2005. It has delivered 26% annualized despite 2008 and 2020 debacles.
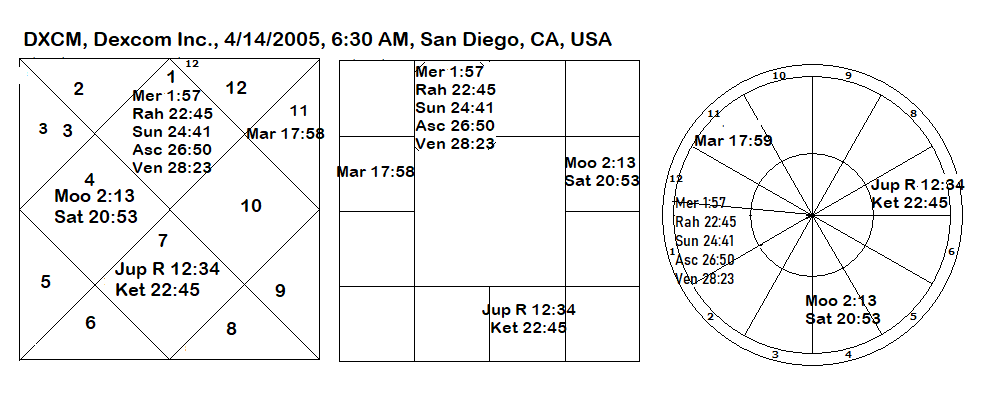
As usual, I start with the ascendant. It has exalted Sun along with Mercury and Venus. The brilliance of the Sun is diminished by its proximity to Rahu and the aspect of Saturn from the fourth house. The aspect of Jupiter from the seventh house compensates for this weakness of the Sun. The weakness of Venus due to combustion is also compensated by the aspect of Jupiter, which itself is very strong because of retrogradation. Another strong planet in the chart is the Moon in the fourth house. It occupies its own sign and has the strength of direction. All centers become strong because of the benefic planets Moon, Venus, and Jupiter. A glance at the Shad-bala table reveals that Jupiter is the strongest planet in the chart. This Jupiter aspect the ascendant, its three occupants, and Mars in the eleventh house, which makes the entire chart reasonably strong.
COIN – Coinbase Global Inc.
(5/2/2021)
Coinbase exchange is an exchange where you can trade cryptocurrencies. It started trading on 4/14/2021. It is a direct listing and not a traditional IPO. But since it started trading on this date, we can use this date to calculate its chart. Its astrological chart looks like this.
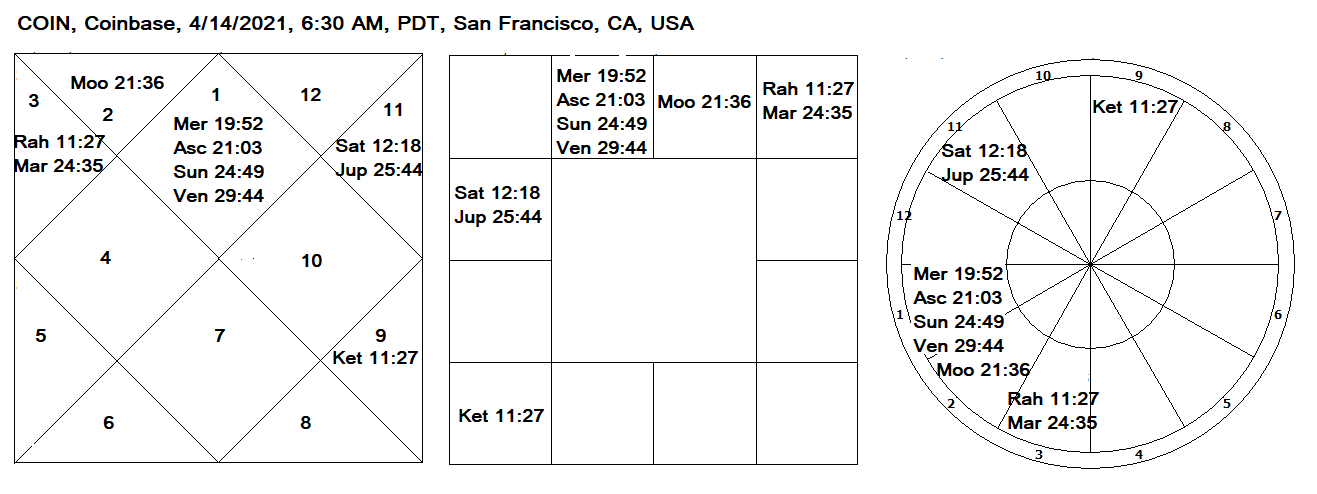
The chart is solid. You can see an exalted Sun in the first house. This indicates that it may be a very popular stock and could easily become a leader stock. The two houses of money have strong planets. The second house has exalted Moon, and the eleventh has Saturn in Aquarius, which is its own sign.
Jupiter occupies the eleventh house. Jupiter influences two malefic planets, Mars and Rahu, in the third house, reducing their malevolence. Interestingly, Jupiter also influences all the Air signs, which means that the Coin-exchange will find innovative ways to adapt itself to any changing environments in the future.
Besides Sun, the ascendant also has Mercury and Venus. Mercury is strong in the first house, but Venus is weak because it is about to change signs and combust. Rahu and Ketu generally give good results in Gemini and Sagittarius, respectively. They are also beneficial here because they are well placed, and their sign-rulers, Mercury and Jupiter, are strong. The exchange of lords of the first and third houses (Mars and Mercury) generally give very successful companies. Strong Saturn shows that it is going to have good longevity, not years, but decades. Saturn is also strong in the Navamsha chart. The Navamsha chart (not shown in the chart above) has two more strong planets, Moon and Mercury.
The starting dasha is of Jupiter, which occupies the eleventh house. This period will continue till June 2024. The next period is a ten years-long period of strong Sun. Needless to say that it would become a leader stock by then, and it would continue to become a stronger and stronger company.
The only stock that comes to mind which has such a robust astrological configuration is AAPL. If the astrological chart of AAPL got 100 marks, the chart of COIN would get 90. It is because Venus is weak in this chart. But if we look at the astrological periods, COIN is starting with a safer period right away, whereas AAPL took quite a few years to exert its superiority.
While comparing it to AAPL, one should treat it like that, a long-term stock. Like AAPL, it will also suffer occasional corrections, maybe severe corrections because Saturn, although strong, influences four planets. But, one should try to buy it at every opportunity. Since it is very high on valuation now, one can wait until it comes down to some reasonable levels. Then, one should buy and hold this stock to pass it on to the next generation.
Please note that these are my views based on astrology. There is no guarantee that it would happen like that.
MELI – MercadoLibre, Inc.
Mercado Libre, Inc. is an Argentine company, and is a great free-market play (mercado libre means free market in Spanish) on the growth of e-commerce in Latin America. The company is following the same tried-and-true business model as Amazon, eBay and PayPal. It’s IPO priced at $18 in August 2007 and continuously rising to around $1850 as of Jan 2021, an impressive 100x increase in stock price.
Here is IPO-date astrology chart.
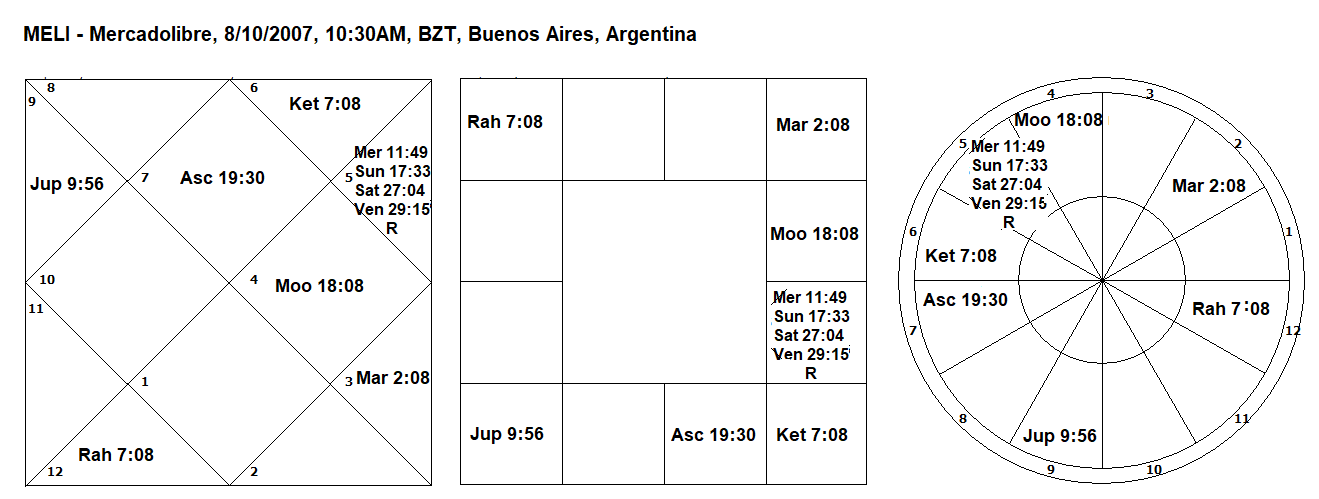
The ascendant lord Venus is in the eleventh house, although weak by degrees, is always good. The lord of second house is Mars is in the house of its enemy Mercury. But it is under the beneficial aspect of strong Jupiter, which is the lord of third house. This Jupiter blesses not only Mars but four planets in the eleventh house to various degrees. These planets include Mercury and the eleventh lord Sun. Moon is another strong planet, which makes tenth house also very strong. Close conjunction of two friends Venus and Saturn is also considered good. The sign-lord of both Rahu and Ketu are strong. All planets are either strong or under the influence of strong Jupiter. Strong planets in third, tenth and eleventh house formed very strong Vasumati Yoga, which can easily overpower a few weaknesses in the chart mentioned earlier. No wonder this stock has produced 42% annualized gain in 13 years.
September 1, 2020
MSCI Inc.
MSCI Inc is another stock that has produced more than 25% annualized since it became public in 2007. This performance is comparable to the stocks like AAPL, ADBE, MSFT, TTD, NVDA etc. although it is not as well-known as them. MSCI Inc., provides investment decision support tools for the clients to manage their investment processes worldwide.
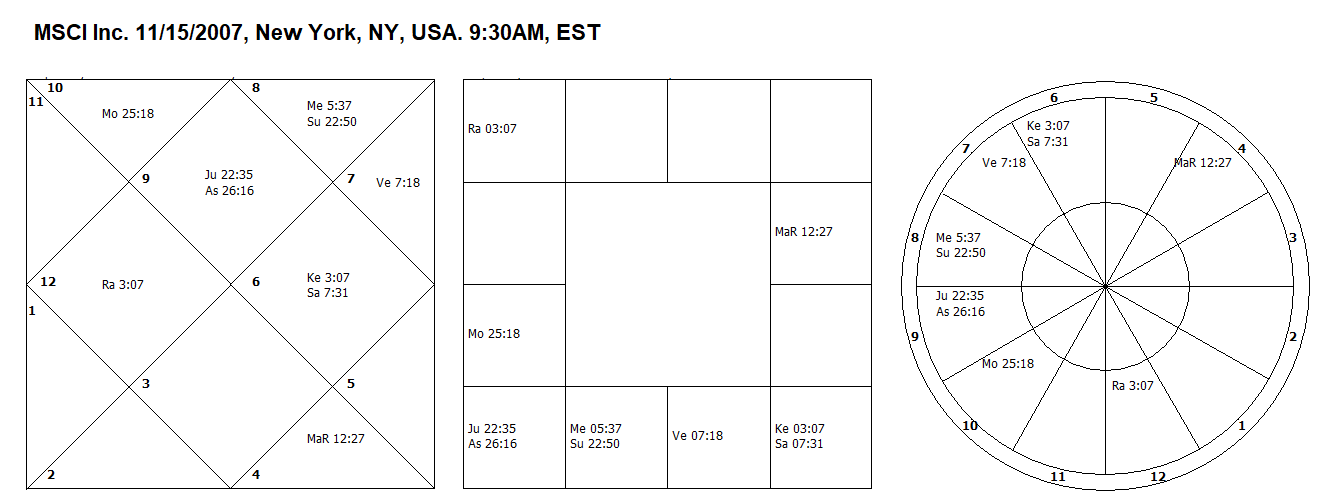
As usual, let us start with the first house. It has Jupiter in its own sign Sagittarius. Jupiter generally is very strong in the first house because of the strength of direction. In this case, Jupiter is in its own positive sign, with no influence of any malefic planet. Jupiter is thus extra strong in this chart. It is well known that if there is a strong Jupiter in the ascendant, it alleviates many deficiencies of the chart. The other benefic planet that I look for is Venus. Venus is also extra strong, because once again it is in its own positive sign, and that too in the eleventh house of income. Moon is weak as it is the sign of Saturn and is aspected by weak Mars in the eighth house. Saturn is also not in a good state because of its conjunction with Ketu. Sun and Mercury are present in the twelfth house and aspected by Saturn. But these two planets are hemmed by two strong benefic planets, which make them reasonably well-behaved. Rahu is well placed and its sign-lord Jupiter is strong. Overall this is an extraordinary chart. One can continue to expect solid performance from this stock.
August 1, 2020
The trade Desk, TTD
The trade desk is a provider of a global technology platform for buyers of advertising. It became public in 2016 at $18 per share, and its price today, in less than 4 years, is $430. Let us see if we can see that.
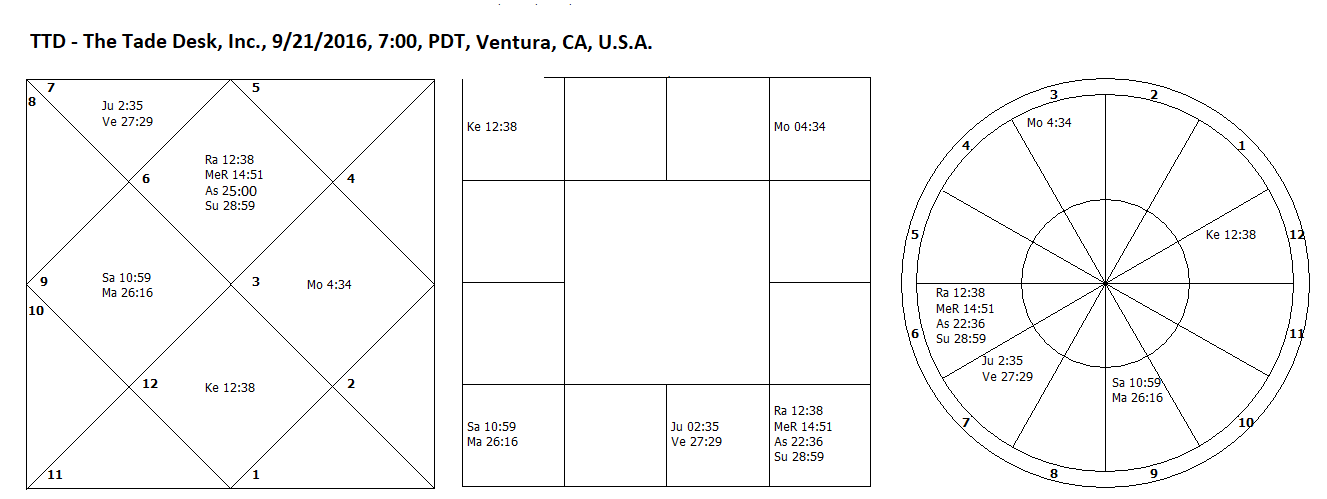
The ascendant is Virgo, with its lord Mercury right there in the first house with north-node. Sun is also present in the first house, which indicates that this company should be recognized right away. The second house of the chart has two benefic planets Venus and Jupiter. Venus is very strong as it is present in its own sign. Jupiter from this house aspects Moon sitting in the tenth house. Thus all three benefic planets are supporting each other. These planets also strengthen the signs of innovation, namely Gemini and Libra. The third and eleventh house do not have any benefic planets, but at least they don’t have any malefic planets either. The malefic north and south nodes are not doing any harm because they are well placed in the Centers and their dispositors are strong. The combination of Mars and Saturn may cause setbacks once in a while. But that would be taken care of timely by the strength and placement of benefic planets. Young investors who have time on their side should take a note of this stock.
July 4, 2020
Shopify Inc. (SHOP)
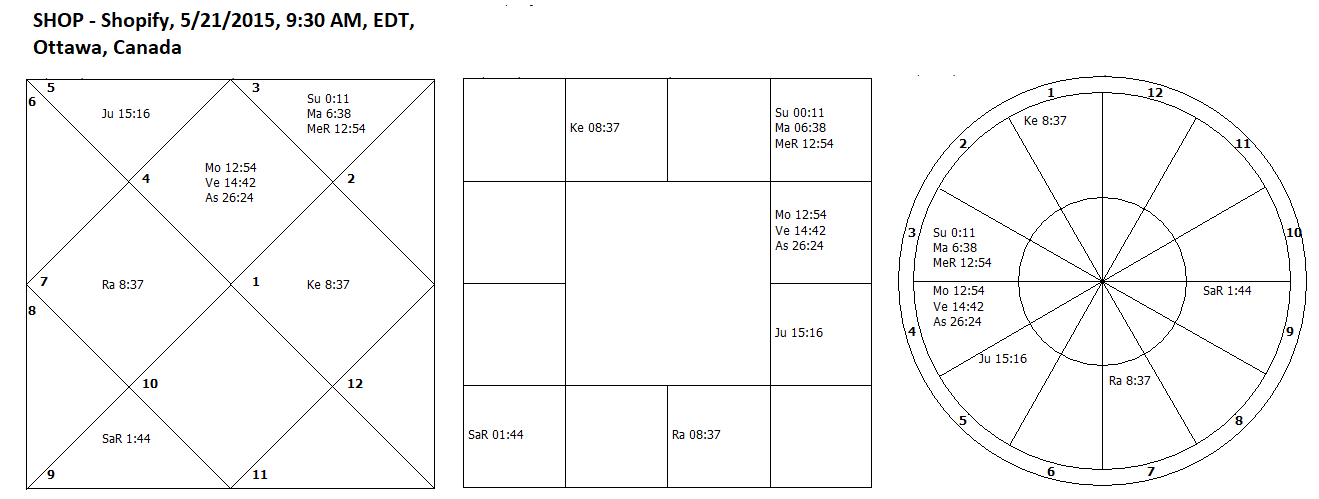
Let us start with the first house as usual. The ascendant is Cancer and its lord Moon is right there. Another benefic planet Venus is sitting very close to it. Therefore ascendant is quite strong along with Moon. Next we look at the second house. It has Jupiter in its friendly sign. The lord of second house appears to be in twelfth house, but in fact it is in the eleventh house. Next we look at the third and eleventh houses. There are no planets in them, but the lord of the eleventh house is in the ascendant and lord of third house is strong in its own sign Gemini. The third house is also influenced by Saturn from the sixth house. Since Saturn rules the eighth house and occupies sixth house, it constitutes Vipreet Raj Yoga. The sign Gemini is strong as it is occupied by its ruler, and a friend Sun, although it also has enemy but Raj-yoga-karak Mars. The sign Aquarius is also aspected by its lord Saturn and Jupiter. It is therefore good. Libra has Rahu, which is also good because its dispositor is in in the ascendant and in good company of Moon. Ketu in Aries in the tenth house is also good as it under the aspect of Jupiter in second house. The opposition of Saturn and Mars and combustion of Mars are not desirable factors. Overall, this is a Four-star not five-star IPO-chart, which is still very very good.
October 2017
Roku Inc. (ROKU)
Roku inc came out as a public company only 2 days ago. Today I am writing about it because I am quite impressed with its astro-chart.
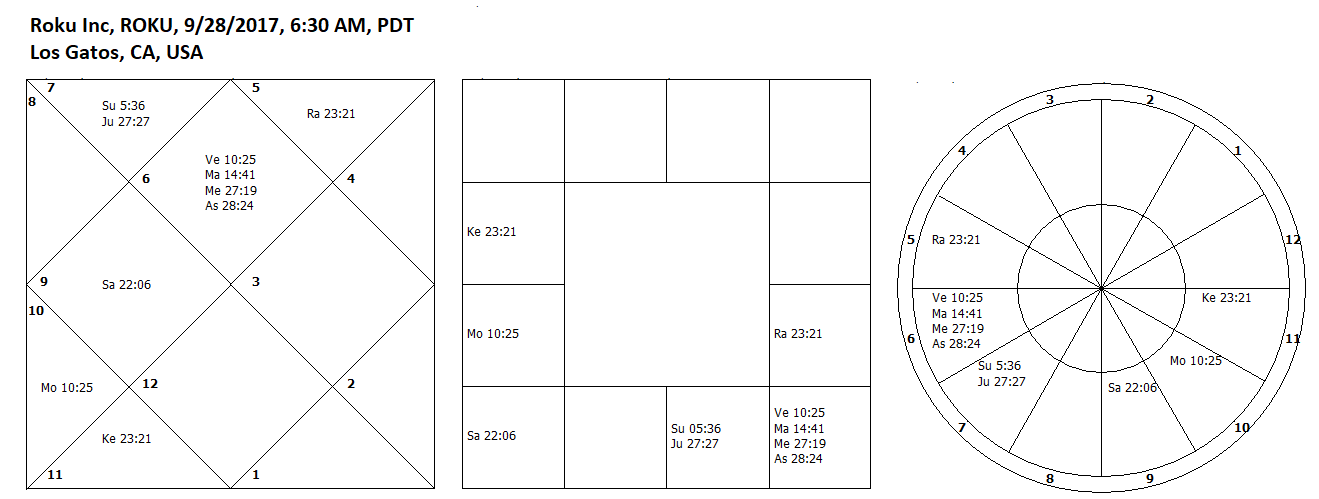
The ascendant is Virgo, with its lord Mercury right there near ascendant longitude. This makes this chart very strong because Mercury is the dispositor of weak Venus and Mars. Second house is also quite good as it is occupied by Jupiter. Since Jupiter is quite far from Sun (22degees) it is not combust, rather shining with the rays of Sun. This shining Jupiter influences signs Gemini, Libra and Aquarius, making it an innovative company. Saturn in the fourth house is not good as it aspects Ketu in the sixth, and three planets in the first house. Moon is also not good, as it is in the sign of enemy Saturn and is surrounded by 2 malefic planets. As a result there would be intermittent drawdowns. But in spite of all the weaknesses in the chart, this company may go on producing good results, because of the strength of Mercury, which is ultimate dispositor of all planets.
I therefore have great hopes from this stock. Please do your own discretion and study before deciding to go in for this stock, as it has already doubled in 2 days.
June, 20, 2020
STARBUX Inc, (SBUX)
Starbux became a public company on 6/26/1992 at a price of $0.32 adjusted for dividends and splits. The price today is $75. This amounts to an increase of 225 times in 28 years. In fact it is more than 300x when count the dividends. Let us look at its first trade day chart.
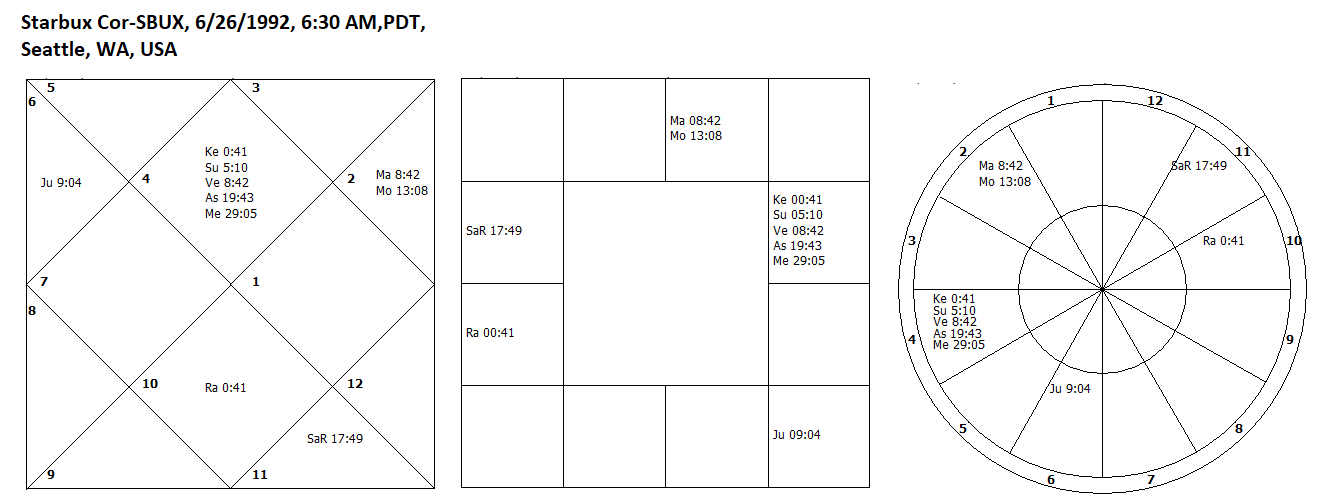
The ascendant is Cancer with four planets, Sun, Ketu, Venus and Mercury. Venus is combust and Sun is dimmed by the closeness of Ketu. Mercury is also not strong as it is at the edge of the sign. But look at the ascendant lord, Moon. It is exalted in the eleventh house, and in the company of Raj-yoga karak Mars. On top of that Moon is aspected by planet of abundance, Jupiter in the third house. When there are too many planets in one sign, the strength of the planets in the sign can be elevated or diminished by the strength of their dispositor. Strength of the planet Moon thus raises the strength of all planets in Cancer. This set up makes first, third and eleventh houses strong. Moon, Mars and Jupiter constitute wealth-producing Chaadar-Mangal and Vasumati yogas. There is an exchange of lords of first (Moon) and eleventh (Venus) houses. Such an exchange is always desirable in the astrology charts of stocks.
Second house is also aspected by Mars and strong Saturn from the eighth house. Saturn is strong as it is in its Mool-Trikona sign. Strong Saturn in a chart helps it to survive for long time. Jupiter while in the third house also influences Rahu in the seventh house. Dispositors of both Rahu and Ketu are strong. In the nutshell this is a very strong chart, but one cannot rule out the occasional corrections due to transit of malefic planets in the first or second house.
September 2014
ALIBABA, (BABA)
This stock has recently come to the market on September 19. People were so excited that they sold many winners to raise enough money to buy as much of this stock as possible. Since in my view no other method can look into the future as good as Astrology, I decided to do careful and thorough analysis of this stock before it came to the market.
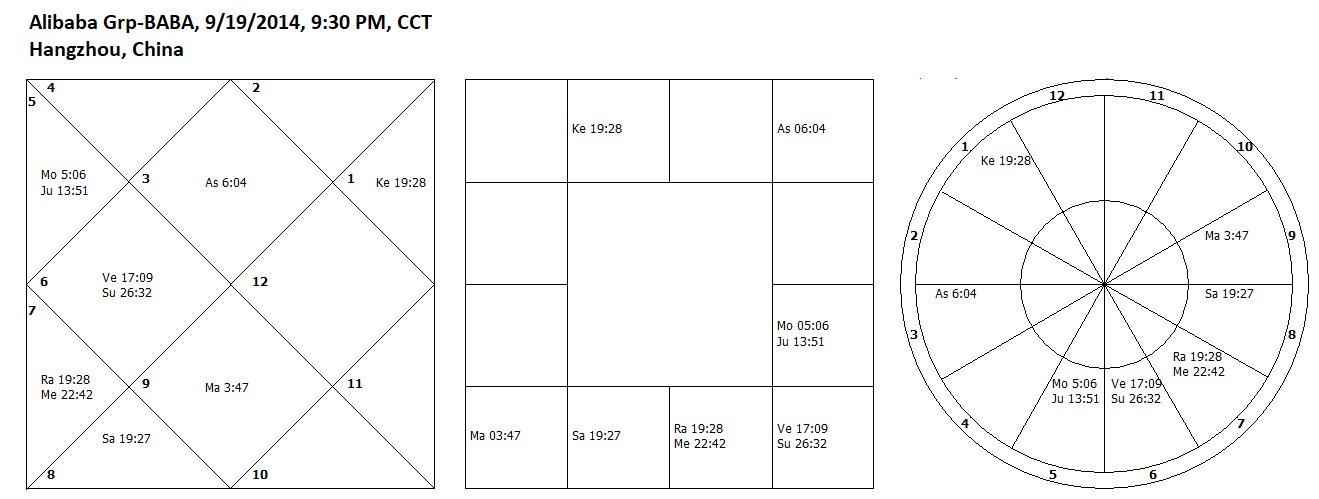
The ascendant is Gemini, and it lord Mercury is in the fifth house in a friendly sign. Such a setup generally produces good stocks. The lord of second house is Moon, which is very strong being in third house in the sign of a friend, and in the company of Jupiter. Third house has two benefic planets, which are friends and support each other in the every possible way. They constitute Vasumati yoga. The sign Aquarius is being influenced by them and the sign Libra is also has a friend in Mercury. Venus is the only planet that appears weak, as it is fallen and combust. But its strength is also increased a bit by exchanging signs with friend Mercury and being in the fourth house. Jupiter sends his blessings to Ketu and Mars. Rahu has a good company of the ascendant lord. Saturn is weak and badly placed and it casts its shadow on Moon, Jupiter, and third house. The stocks therefore was slow to start, and gets occasional beatings.
August 2014
Chipotle Mexican Grill, (CMG)
This month I am going to write about a stock, which clearly shows the usefulness of the astro-charts. It is only the Astrological analysis that would have strongly suggested at the time of an IPO that this stock has an enormous potential. The stock is Chipotle Mexican Grill. This stock produced 3000% between its IPO date (2006)and 2014. Here is the chart of this stock.
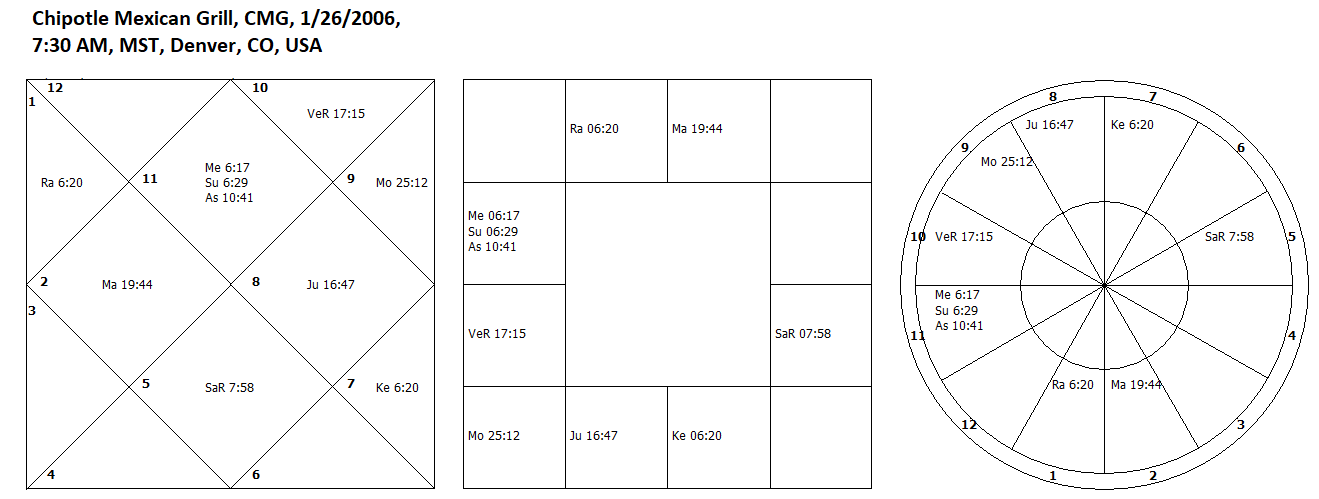
The lord of the first house is in the seventh house and in return aspects the ascendant point closely. The lord of second house is in the tenth house and aspects the second house back. Moon is in the eleventh house and hemmed between two benefic planets Jupiter and Venus. The planet Venus is considered good in the twelfth house. Although there is no planet in own house or exalted, yet they for many form mutual relationships. Jupiter and Mars are present in the central houses and form a relationship by mutually and closely aspecting each other. That is basically mutual aspect of the lords of eleventh and third houses. Sun and Saturn not only exchange signs but also aspect each other. Mars and Saturn also, mutually influence each other. Their relationship is especially good because Saturn rules first and Mars the third house. Both Saturn and Mercury have dik-bala, but Mercury is completely combust in the first house. This is not good. The sign Libra is occupied by Ketu, but Gemini has the influence of benefic Moon.
So this astro-chart has everything of superb quality I need in a stock. No wonder this stock has produced so much gains in the first 8 years of its existence.
December 2013
Google Inc, GOOG
It was my intention to write about one stock-chart a month, which I could not follow for some reasons. I am now going to resume my commitment with my top rated stock, Google. It came to public in 2004 at $85 a share, and it is now more than $1050 a share.
This change represents 12 times growth of value in 9 years, a phenomenal feat by any means.
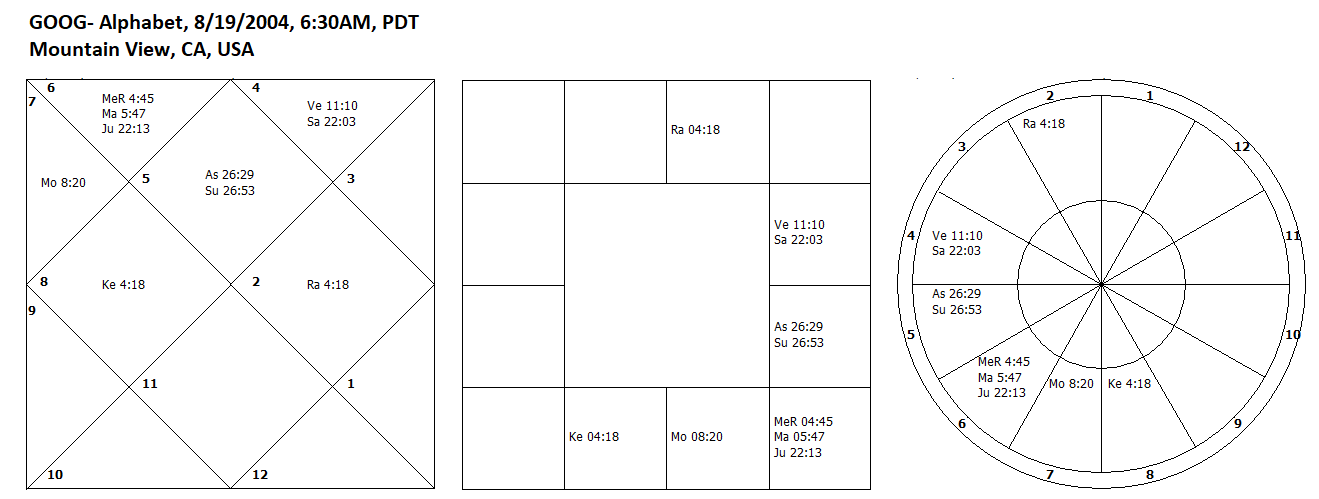
Ascendant lord Sun is not only in the ascendant but also almost at the same longitude. This is a sign of a very popular stock. Lord of second house is also in the second house. It makes it also quite strong. It is also the lord of the eleventh house and it is making a close conjunction with Mars. Although Mars is its enemy, yet is a Raj-yoga karak in this chart. The planet of abundance Jupiter is also present in the second house. A benefic planet Moon is present in the third house. Although sign Gemini is not occupied by any planet, yet Libra is occupied by Moon and Aquarius is aspected by Sun. A unique yoga is present in the chart. The ascendant is surrounded by benefic planets Venus in the twelfth and Jupiter in the second house. The conjunction of Venus and Saturn is also a meeting of two friends. Venus exchange signs with Moon. Any connection between Venus, Moon and Jupiter is generally good. The malignancy of Rahu and Ketu is reduced because they occupy central houses. Here Saturn does influence more than 3 planets and houses by conjunction or aspect. As a result occasional set back cannot be avoided. But overall this is undoubtedly a leader stock.
I would buy this buy stock whenever a correction occurs in the market.
September 2012
Philip Morris Int, PM
Philip Morris is a very old company, which is now called Altria. Altria spun off Philip Morris International on March 17, 2008. Its HQ is in New York and the operation center is in Lausanne, Switzerland, which oversees the operations in more than 160 countries. Its state of incorporation is Virginia, USA.
Earlier I studied this chart made with Sidereal Zodiac using Lahiri Ayanamsha. It was my core holding as Moon was very strong in the fourth house of this chart. Jupiter was also quite strong in the ninth house in its Mool-Trikona sign. PM has not produced the desired results. It lagged the stock market averages for years. But when I studied the chart with zero Ayanamsha (Tropical Zodiac) the weaknesses of the chart showed up, which fully explains its performance. Now I study Tropical charts commonly used by Western astrologers, but interpret them with basic Parashari system. I have now redrawn and reinterpreted all the charts on this website.
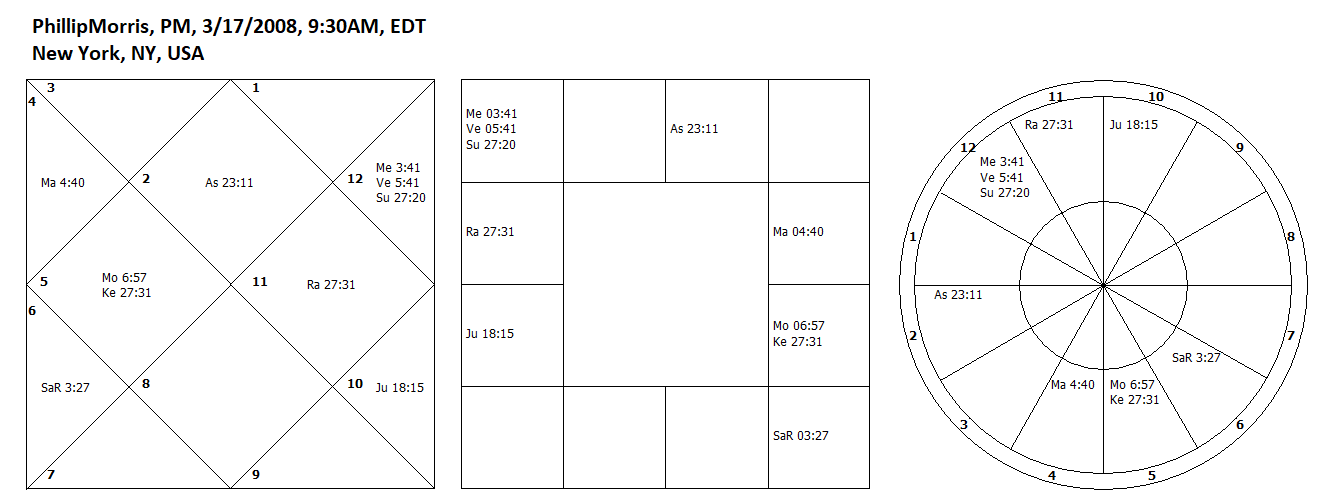
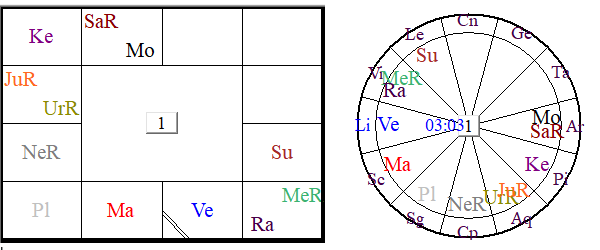
Ascendant is Taurus now and its ruler Venus is exalted in eleventh house. It is very good. But the lord of the second house Mercury is fallen in the eleventh house. Third house has fallen Mars and ninth house has fallen Jupiter. So basically there are three fallen planets (including Mercury) in the chart. Close conjunction of Mercury and Venus and aspect of Raj-yoga-karak Saturn on them are good features. The signs Gemini, Libra and Aquarius have no benefic influence, which is not good. Moon is good in the fourth house. Overall there are both good features and bad features in the chart. Therefore this is at best a mediocre chart. And that is what its performance has been.
August 2012
Facebook, FB
I will start with the astro-chart of Facebook, FB. Face book is a popular company, which became public on May 18, 2012. There were a lot of expectations from this stock, which did not materialize due to the discrepancies that occurred during the initial public offering. This can be easily seen from the fact that the IPO was done close to the solar eclipse (May 20).
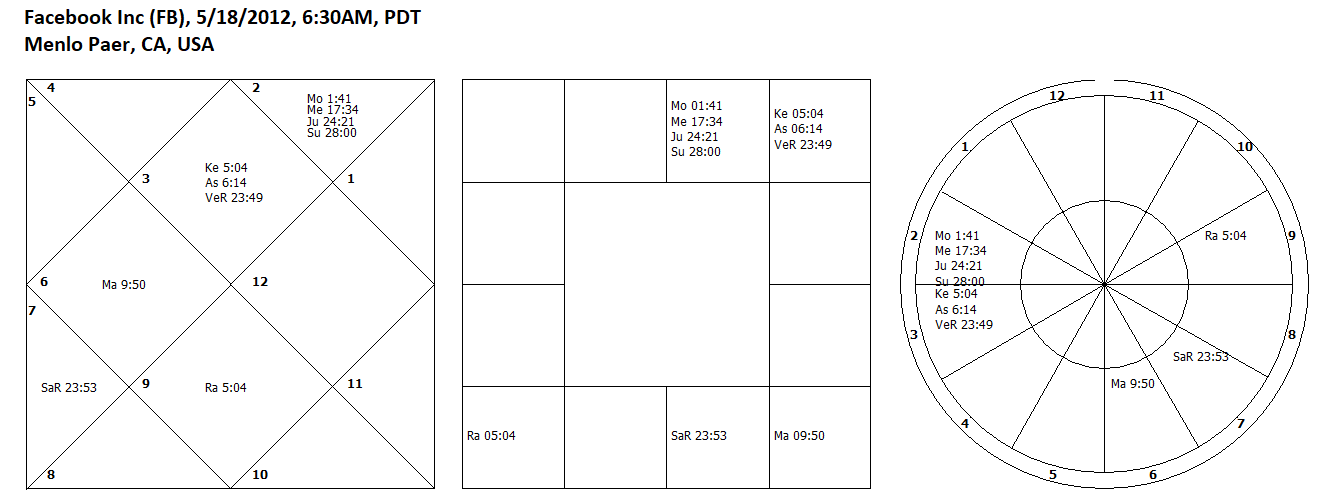
The most striking feature of this chart is that it has exalted Saturn in the fifth house. It therefore influences both second and eleventh house, the houses of wealth and income. A strong Saturn in a chart of a company suggests that it would survive for a long time. The sign Gemini in the first house is generally a very favorable situation. It has a social planet Venus, which being in friendly sign and retrograde is quite strong. Venus is the dispositor of five planets in the chart, and thus providing them additional strength. Venus is Yogi-planet and it exchanges signs with Mercury. Mercury being in a friendly sign and in the vicinity of Jupiter is good. But the combustion of Jupiter in the twelfth house is not good. Moon is the lord of second house and occupies twelfth house. This also cannot be regarded a positive feature, but Moon is exalted, so it is not too bad. The placement of Mars, Rahu and Ketu in the central house reduces their malefic nature but does not make them benefic, because the influence of Venus on nodes and of Jupiter on Mars is too far.
Overall, it can be termed as a long-term holding kind of stock, but one should expect occasional and may be severe drawdowns.
Next month I plan to write about Philip Morris.